S&P500 Daily Action Areas & Price Targets 29/10/26

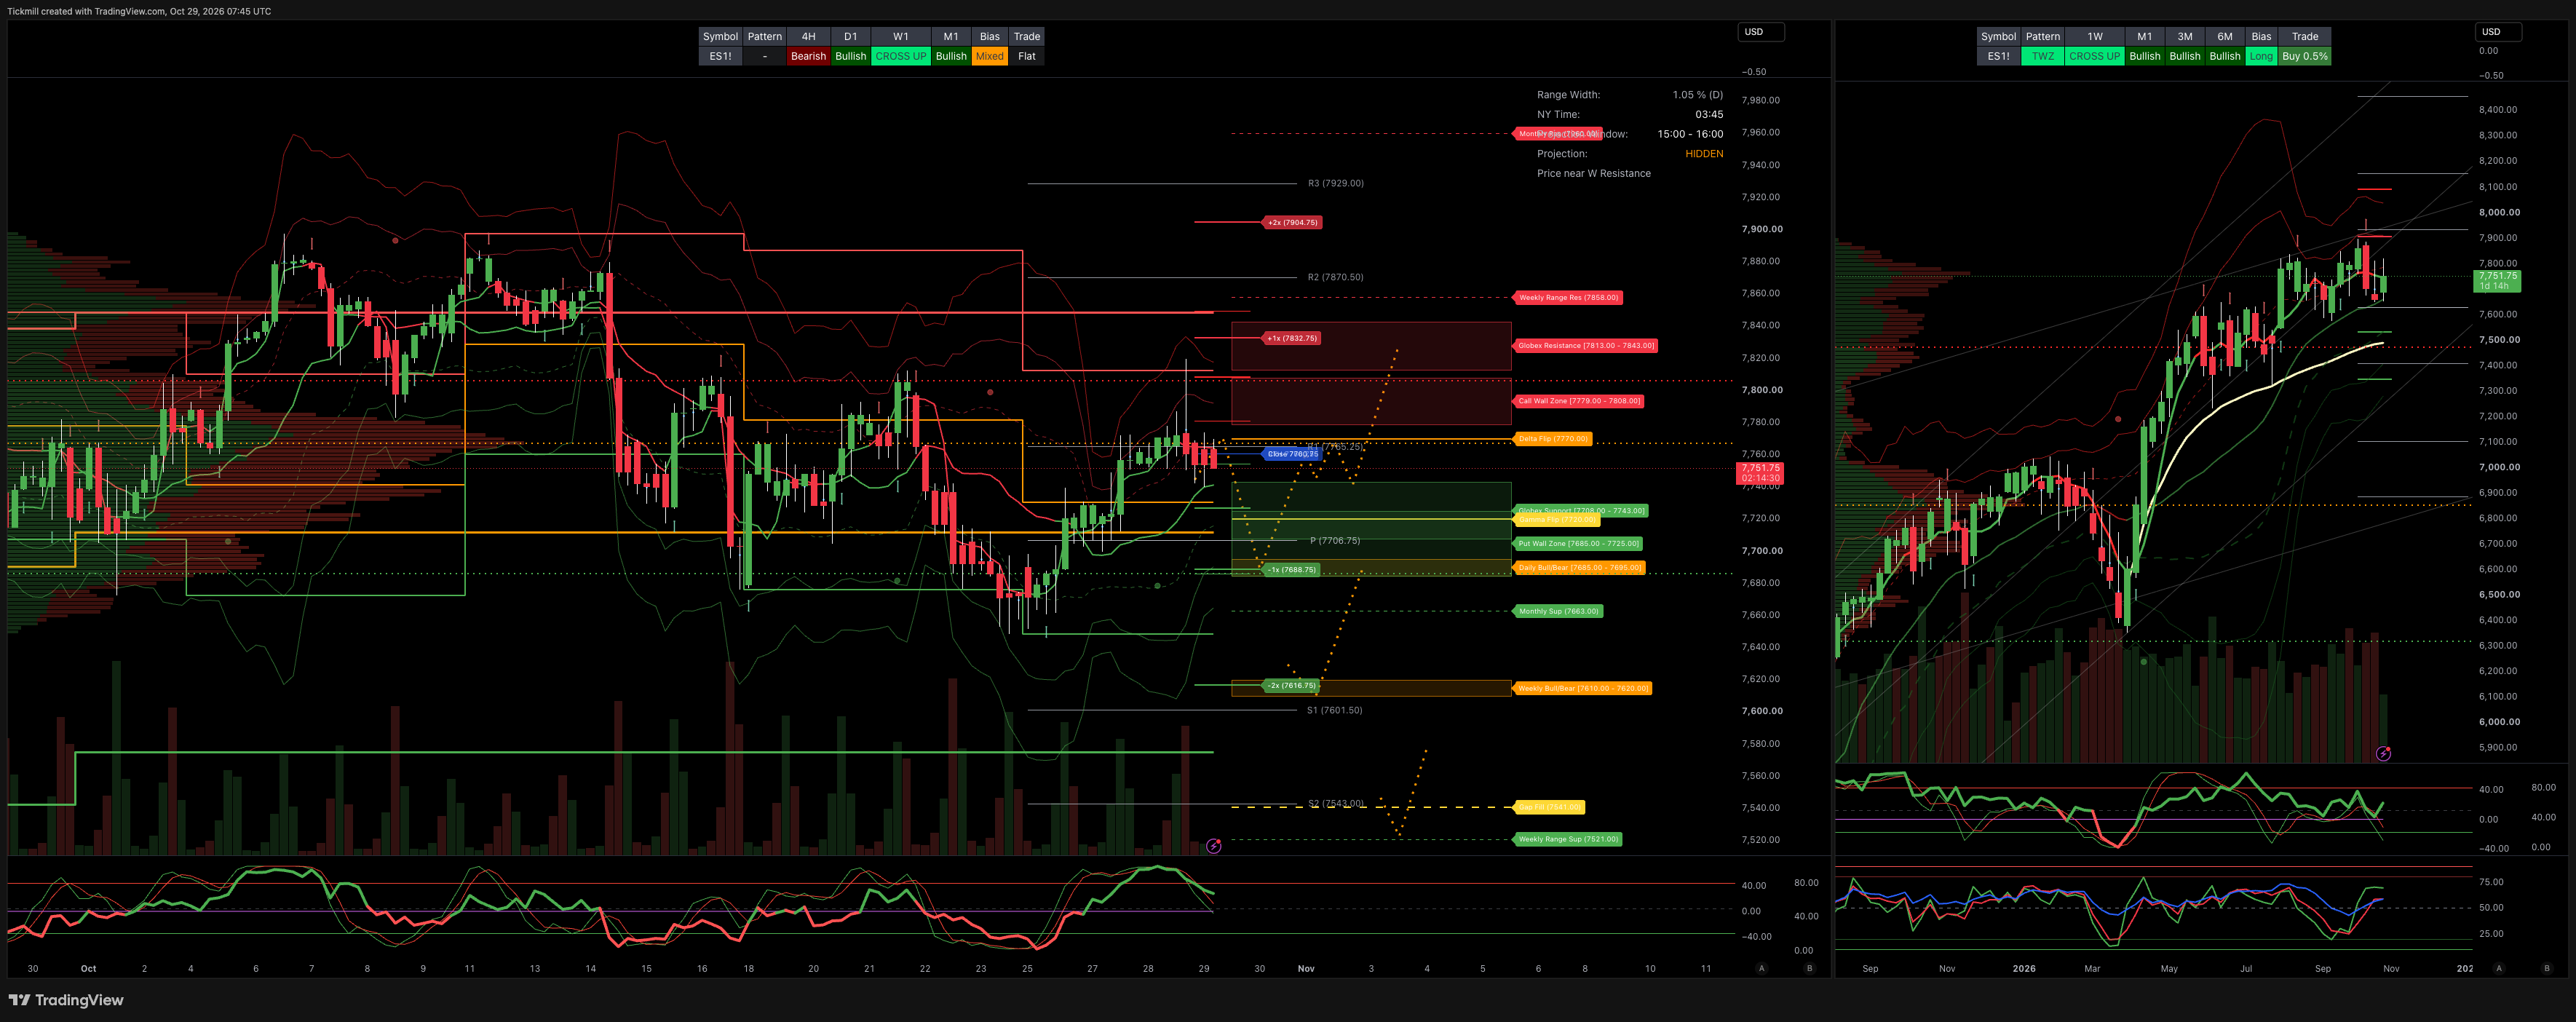
S&P500 Daily Action Areas & Price Targets 29/10/26
***QUOTING ES1!(Z CONTRACT LEVLES) FOR CASH US500 EQUIVALENT LEVELS, SUBTRACT POINT DIFFERENCE***
MONTHLY-WEEKLY& DAILY LEVELS
MONTHLY BULL BEAR ZONE 7440/7400
MONTHLY RANGE RES 7960 SUP 7663
WEEKLY BULL BEAR ZONE 7620/10
WEEKLY RANGE RES 7858 SUP 7521
DAILY BULL BEAR ZONE 7695/85
GLOBEX RANGE SUP 77743/08 RES 7813/43
GAMMA FLIP 7720
DELTA FLIP 7770
CALL WALLS 7779/7808
PUT WALLS 7725/7685
GAP FILL 7541
DAILY STRUCTURE - OTFH - 7751
WEEKLY STRUCTURE - BALANCE - 7897/7575
MONTHLY STRUCTURE - OTFH - 7542
VIX BULL BEAR ZONE 17.7
VVIX-to-VIX The ratio of 5.62 compression is the main market driver, with the VVIX dropping more than the VIX, maintaining the ratio within the 5.0 to 6.0 range. This indicates a decrease in short-term tail risk insurance premiums, favoring volatility-selling strategies. Above 6.0 – 7.0+ signals higher risk and demand for options due to market volatility concerns.
PRIMARY TRADES & TARGETS
LONG ON REJECT/RECLAIM DBBZ TARGET > CLOSE > DAILY RANGE RES
***ADDITIONAL SETUPS & TARGETS HIGHLIGHTED ON THE CHARTS***
(I FADE TESTS OF 2 SIGMA LEVELS ESPECIALLY INTO THE FINAL HOUR OF THE NY CASH SESSION AS 90% OF THE TIME WHEN TESTED THE MARKET WILL CLOSE ABOVE OR BELOW THESE LEVELS)
SPX PUT/CALL RATIO 1.14 (The numbers reflect options traded during the current session.) A put-call ratio below 0.7 is generally considered bullish, and a put-call ratio above 1.0 is generally considered bearish.
JHEQX Upside cap (~7,920–7,950): Dealer gamma hedging at this call strike creates resistance, with market makers likely selling futures into strength and limiting volatility. Downside cushion (~7,270): If SPX drops 5% into Q4, long put gamma may force dealers to buy futures as the index falls, helping stabilize prices. Expiration: December 31, 2026. Strong pinning effects are likely near key strikes into year-end expiration.
DEC2025 OPEX to DEC2026 OPEX is 945 points giving us a range of [5889,7779]
Notes On Structure Implications
Balance: This refers to a market condition where prices move within a defined range, reflecting uncertainty as participants await further market-generated information. Our approach to balance includes favouring fade trades at the range extremes (highs/lows) while preparing for potential breakout scenarios if the balance shifts.
One-Time Framing Higher (OTFH): This represents a market trend where each successive bar forms a higher low, signalling a strong and consistent upward movement.
One-Time Framing Lower (OTFL): This describes a market trend where each successive bar forms a lower high, indicating a pronounced and steady downward movement.
JPM FICC & EQUITY TRADING DESK VIEWS
JPMORGAN MARKET INTEL & TRADING DESK BRIEFING: FED HOLD, TECH DIVERGENCE & MIDTERM ASYMMETRY
Source Document: JPMorgan US Market Intelligence, TMT & Thematic Trading Desks (Mark Schilsky, Kaitlyn Bowman, Priyanka Thapa)
Date: Late October 2026 (Pre-Market October 29, 2026)
THE TAKE: FED DISCONNECT, HIGH-BAR TECH DISPERSION & THE POST-MIDTERM PLAYBOOK
US equity benchmarks advanced modestly (S&P 500 +0.3%, Nasdaq-100 +0.5%, Russell 2000 +0.4%) even as underlying market breadth lagged slightly (SPW essentially flat; Mag 7 mostly lower). Energy led cross-asset momentum, with WTI Crude rallying +2.11% to $102.01/bbl and US Natural Gas surging +4.45% to $2.82/MMBtu.
The Federal Reserve held policy rates steady with two dissents (Cook and Hammack). JPM Market Intel flags the hold as an incremental dovish outcome given that real GDP is tracking at an above-trend ~5% annualized pace (per the last two Flash PMI prints) with rising input costs. With the Fed pointing to tightening financial conditions via credit markets as a reason for restraint, OIS markets continue to price an ~85% probability of a December rate hike, steepening the Treasury yield curve (2Y -6 bps, 10Y/30Y flat to +2 bps).
After the bell, tech earnings delivered severe dispersion that highlights the market's intolerance for growth deceleration:
Microsoft (
MSFT+5% AH): Delivered a clean beat, with Azure topping buyside expectations by +1 point and Operating Income beating by +5%.Alphabet (
GOOGL-7% AH): Fell sharply after a comprehensive miss across Search (-2% vs. buyside bogeys despite 5-year high query volume due to severe pricing compression), YouTube, and Google Cloud revenue.ServiceNow (
NOW-15% AH): Plummeted following a CRPO miss and guidance projecting sequential CRPO to decelerate by -250 bps in Q4.
MACRO & LABOR READ-THROUGH FROM CORPORATE EARNINGS
Labor Resiliency vs. Productivity Decoupling: ADP reported Q1 pay-per-control growth of 2% (raising its FY27 outlook to ~1%) with gross layoffs hovering near multi-year lows. However, transport bellwethers like C.H. Robinson (
CHRW, headcount -10.4% YoY) and Old Dominion (ODFL, headcount -4% YoY) are actively decoupling volume growth from headcount via automation.Medical & Fringe Benefit Inflation: Wage pressure is compounding through benefit inflation—ODFL cited fringe benefits surging to 42.8% of wages (vs. 39.7% in 3Q25), driven by rising health and dental costs.
Data Center & Power Infrastructure Demand: Accelerating globally without sign of deceleration. GE Vernova (
GEV) expanded its backlog to ~$200 billion (+$30B in new Q3 orders), while Vertiv (VRT) reported organic data center orders up >100% YoY with EMEA order pipelines doubling.
MIDTERM ELECTIONS DESK ODDS & PREDICTION SPREADS
Polling averages (DDHQ / RCP) and prediction markets (Polymarket / Kalshi) reflect a high probability of divided government:
Race / Chamber | DDHQ Polling Lead | RCP Polling Lead | Polymarket Odds | Kalshi Odds |
US House of Reps | Dems +3.2 | Dems +2.1 | Dems 92.0% | Dems 90.7% |
US Senate | Dems +1.1 | Dems +0.8 | Dems 66.0% | Dems 64.0% |
Georgia | Dems +10.0 | Dems +8.2 | Dems 95.5% | Dems 94.9% |
North Carolina | Dems +9.5 | Dems +9.9 | Dems 97.7% | Dems 96.6% |
Minnesota | Dems +6.8 | Dems +5.1 | Dems 86.0% | Dems 83.0% |
Texas | Dems +4.2 | Dems +1.8 | Dems 69.0% | Dems 66.0% |
Ohio | Dems +3.4 | Dems +3.3 | Dems 68.0% | Dems 68.0% |
Iowa | GOP +0.2 | GOP +0.6 | GOP 58.0% | GOP 59.0% |
Tactical Read: Prediction markets assign a ~91–92% probability to Democrats flipping the House. Under a Republican presidency, this locks in divided government, legislative gridlock, and heightened federal funding uncertainty.
JPM THEMATIC INVESTING BASKET TRADE IDEAS
LONG US Holiday Spend (
JPUXHOL):Thesis: Strong consumer cash levels, accelerating wage momentum in lower/middle tiers, and supportive Q4 seasonality.
Positioning: Gains MTD have been powered by short covering rather than fresh long allocation, leaving substantial room for long institutional capital to enter.
MIDTERM ASYMMETRY PAIR: SHORT Federal Gov Contractors ex-Defense (
JPUXFEDB) / LONG ACA Exchange Levered (JPUXACA):Thesis: Short funding risk, own the policy concession. Divided government threatens continuing resolutions and delays appropriations for non-defense federal contractors. Conversely, legislative compromise is likely to put Affordable Care Act exchange subsidies back on the negotiating table.
Core Market Intel Stance:
Tactically Bullish on SPX: Reiterate overweight on equities based on ~5% annualized real GDP growth and strong S&P 500 pre-earnings forecasts (~13% rev growth, ~30% EPS growth).
Hedge the Primary Risk (Middle East War Spike): While political chatter warns of AI dips on a Blue Wave, the desk views geopolitical escalation (threats to Gulf/Saudi energy infrastructure and Russian refining capacity while US SPR is depleted) as the true left-tail risk. Hedge by owning crude oil longs and long equity index volatility.
CATALYST WATCH TOMORROW (OCTOBER 29)
US Macro Data (8:30 AM ET): Core PCE Price Index, Personal Income/Spending, Q3 Advance GDP, Initial Jobless Claims.
Global Central Banks: ECB Deposit Facility Rate Decision at 9:15 AM ET (expected on hold).
Key Earnings Prints:
BMO: Caterpillar (
CAT), Eli Lilly (LLY), Mastercard (MA), Merck (MRK), Linde (LIN).AMC: Amazon (
AMZN), Apple (AAPL), Intel (INTC), Coinbase (COIN), Digital Realty (DLR), Stryker (SYK).
Disclaimer: The material provided is for information purposes only and should not be considered as investment advice. The views, information, or opinions expressed in the text belong solely to the author, and not to the author’s employer, organization, committee or other group or individual or company.
Past performance is not indicative of future results.
High Risk Warning: CFDs are complex instruments and come with a high risk of losing money rapidly due to leverage. 68% and 74% of retail investor accounts lose money when trading CFDs with Tickmill UK Ltd and Tickmill Europe Ltd respectively. You should consider whether you understand how CFDs work and whether you can afford to take the high risk of losing your money.
Futures and Options: Trading futures and options on margin carries a high degree of risk and may result in losses exceeding your initial investment. These products are not suitable for all investors. Ensure you fully understand the risks and take appropriate care to manage your risk.
Patrick has been involved in the financial markets for well over a decade as a self-educated professional trader and money manager. Flitting between the roles of market commentator, analyst and mentor, Patrick has improved the technical skills and psychological stance of literally hundreds of traders – coaching them to become savvy market operators!