S&P500 Daily Action Areas & Price Targets 15/9/26

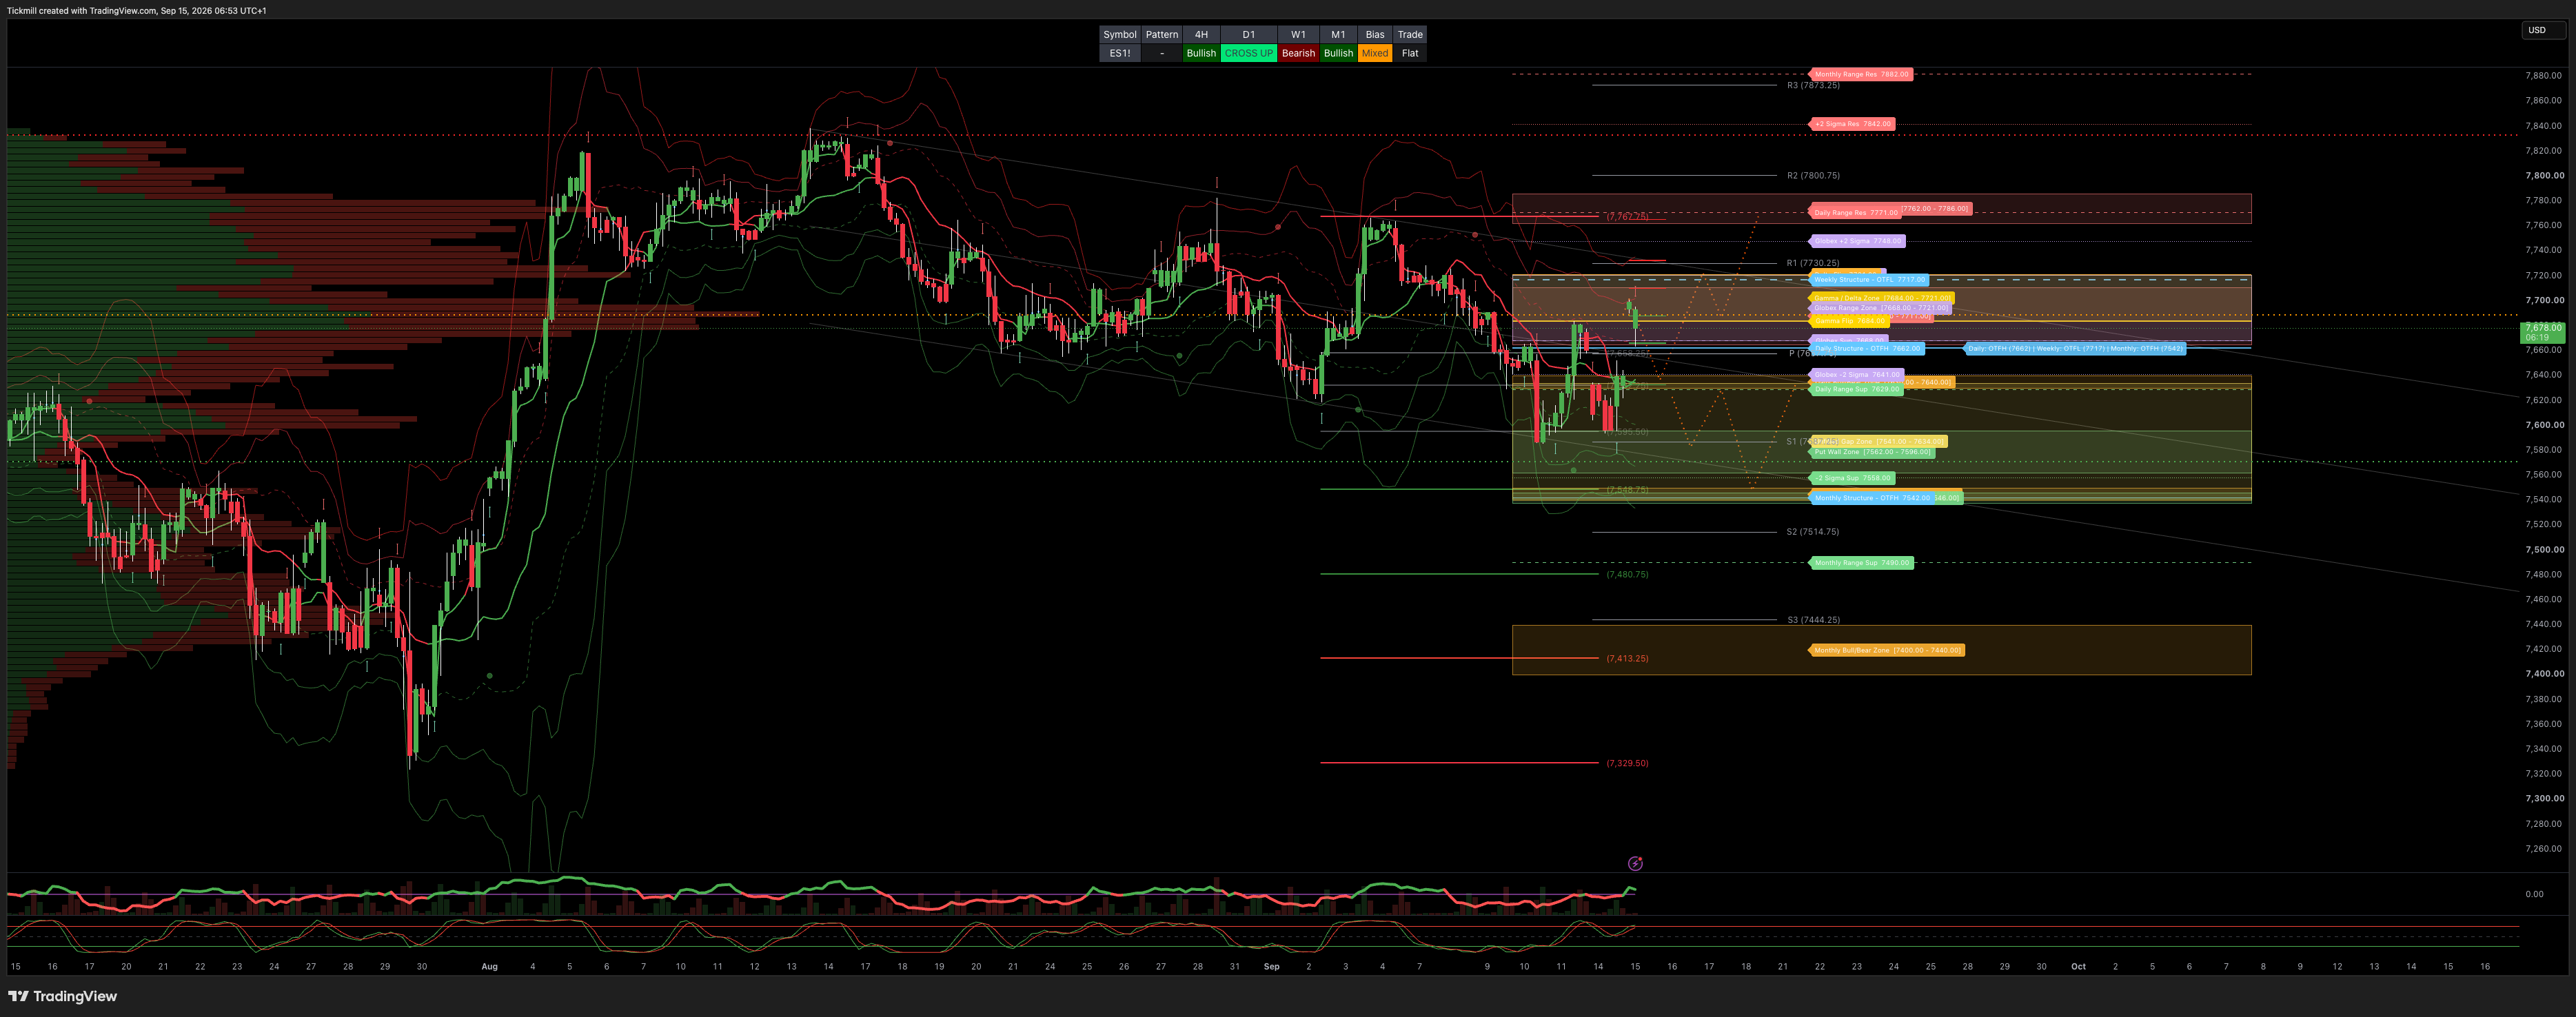
S&P500 Daily Action Areas & Price Targets 15/9/26
***QUOTING ES1!(Z CONTRACT LEVLES) FOR CASH US500 EQUIVALENT LEVELS, SUBTRACT POINT DIFFERENCE***
MONTHLY-WEEKLY& DAILY LEVELS
MONTHLY BULL BEAR ZONE 7440/7400
MONTHLY RANGE RES 7882 SUP 7490
WEEKLY BULL BEAR ZONE 7550/40
WEEKLY RANGE RES 7762/86 SUP 7538/46
DAILY BULL BEAR ZONE 7640/30
DAILY RANGE RES 7771 SUP 7629
2 SIGMA RES 7842 SUP 7558
GLOBEX RANGE RES 7721 SUP 7668
2 SIGMA RES 7748 SUP 7641
GAMMA FLIP 7684
DELTA FLIP 7721
PUT WALLS 7562/7596
CALL WALLS 7711/7665
UNFILLED GAPS 7634 - 7541
DAILY STRUCTURE - OTFH - 7662
WEEKLY STRUCTURE - OTFL - 7717
MONTHLY STRUCTURE - OTFH - 7542
VIX BULL BEAR ZONE 17.3 (VVIX / VIX) 5.19 A ratio near 5.2 suggests normal, stable volatility expectations, with VIX options pricing aligned to baseline fear gauges and no extreme stress or panic divergence.
PRIMARY TRADES & TARGETS
LONG ON REJECT/RECLAIM DBBZ TARGET DAILY RANGE RES
LONG ON REJECT/RECLAIM WBBZ TARGET
***ADDITIONAL SETUPS & TARGETS HIGHLIGHTED ON THE CHARTS***
(I FADE TESTS OF 2 SIGMA LEVELS ESPECIALLY INTO THE FINAL HOUR OF THE NY CASH SESSION AS 90% OF THE TIME WHEN TESTED THE MARKET WILL CLOSE ABOVE OR BELOW THESE LEVELS)
SPX PUT/CALL RATIO 1.11 (The numbers reflect options traded during the current session.) A put-call ratio below 0.7 is generally considered bullish, and a put-call ratio above 1.0 is generally considered bearish.
JHEQX Q3 Collar Short Call Cap: ~7,750 – 7,900 - Long Put Strike: ~7,050 – 7,100 (approx. 5% downside protection) Short Put Strike: ~5,950
DEC2025 OPEX to DEC2026 OPEX is 945 points giving us a range of [5889,7779]
Notes On Structure Implications
Balance: This refers to a market condition where prices move within a defined range, reflecting uncertainty as participants await further market-generated information. Our approach to balance includes favouring fade trades at the range extremes (highs/lows) while preparing for potential breakout scenarios if the balance shifts.
One-Time Framing Higher (OTFH): This represents a market trend where each successive bar forms a higher low, signalling a strong and consistent upward movement.
One-Time Framing Lower (OTFL): This describes a market trend where each successive bar forms a lower high, indicating a pronounced and steady downward movement.
GOLDMAN SACHS FICC & EQUITY TRADING DESK VIEWS
EQUITY & VOL DESK BRIEFING: ROTATION & FACTOR DISPERSION
Author: Mitch Jeter (Goldman Sachs Analyst, FICC & Equities) | Date: September 14, 2026
THE TAKE: RARE SOFTWARE-OVER-SEMIS ROTATION DRIVES EXTREME FACTOR DISPERSION
US equities closed lower on the session but staged an impressive intra-day bounce off session lows (NDX rallied >1% off its bottom). The defining market dynamic was a violent factor rotation out of AI infrastructure and hardware following Anthropic CEO Dario Amodei’s weekend essay calling for a slower pace of frontier model development.
The Software vs. Semis pair (GSPUSOSE) surged +12.56%—a 2.5 standard deviation move. Concurrently, AI vs. AI-at-Risk (GSPUARTI) dropped -9.96% (its worst single-day move since Deepseek, representing a -2.2 std dev drop). Momentum pair spreads widen to levels last seen around the 2020 US presidential election.
Macro yield and oil pressure eased slightly late in the session: 10-Year yields briefly touched 5.0% for the first time since October 2023 before pulling back, while crude moderated after Russia and Ukraine reached an agreement to refrain from targeting each other's energy infrastructure. Fed funds futures now price in a ~91% probability of a rate hike at Wednesday's FOMC meeting.
MARKET SUMMARY & ASSET MATRIX
Asset / Index | Closing Level / Price | Session Change | Volatility & Desk Color | Institutional & Desk Flow |
S&P 500 (SPX) | 7,619.00 | -0.48% | Implied move through tomorrow: 0.52% | MOC: $280M to BUY; 2-3y downside sold |
Nasdaq-100 (NDX) | 29,127.00 | -0.82% | Skew bid; vol bid in gamma, offered in back | Rallied >1% off intraday lows |
Russell 2000 (RUT) | 2,896.00 | -24 bps | Outperformed spot; fixed strike vol & skew offered | Small-caps held up on rate moderation |
Dow Jones (DJI) | 52,421.00 | -29 bps | - | Outperformed tech-heavy indices |
US 10Y Treasury | 4.9854% | +1.9 bps | Yields pulled back late session | 91% hike chance priced for Sept 16 FOMC |
WTI Crude | $101.82 | +1.78% | 9th green close in 10 sessions | Supported by postponed GCC-Iran talks |
Gold | $4,283.00 | -1.52% | Pulled back amid higher DXY (+36 bps to 99.48) | Profit-taking into strong USD |
Bitcoin | $78,992.00 | +2.16% | Outperformed traditional risk assets | Decoupled from tech hardware weakness |
CBOE VIX | 17.13 | +8.14% | Gamma tenors bid in NDX / IGV | Surface vol elevated into FOMC |
FACTOR & BASKET MOVERS
Software vs. Semis (
GSPUSOSE): +12.56% (+2.5 $\sigma$ move). Semis dumped (SMH -4.5%) while software exploded higher (GS Expensive Software BasketGSCBSF8X+6.6%).AI vs. AI-at-Risk (
GSPUARTI): -9.96% (-2.2 $\sigma$ move). Worst single-day contraction since the Deepseek shockwave.Momentum Factor Spreads: 3-Month Momentum (
GSPHRMO3) +6.07% vs. 12-Month Momentum (GSPRHIMO) -6.71%, creating the widest momentum spread divergence since November 2020.
INSTITUTIONAL FLOWS & DERIVATIVES COLOR
Desk Activity (3/10 Rating): Desk finished -455 bps better for sale.
Asset Managers: Net sellers of -$1B (supply in Communication Services, Industrials, and Tech vs. minor macro ETF demand).
Hedge Funds: Small net sellers, concentrated in Tech and macro products.
Options & Skew Dynamics:
NDX & SPX: Skew was bid across NDX and SPX, but long-dated (2–3 year) downside puts saw active institutional selling.
Sector Volatility Dislocation: IGV (Software) vol was bid across the entire curve (especially in front-end gamma), while SMH (Semis) vol was unexpectedly offered despite the spot sell-off.
Notable Option Rolls:
NVIDIA (NVDA): Sizable call spread roll executed—customer bought 70,000 NVDA Nov 230/275 Call Spreads while selling 35,000 Dec 245/300 Call Spreads.
Disclaimer: The material provided is for information purposes only and should not be considered as investment advice. The views, information, or opinions expressed in the text belong solely to the author, and not to the author’s employer, organization, committee or other group or individual or company.
Past performance is not indicative of future results.
High Risk Warning: CFDs are complex instruments and come with a high risk of losing money rapidly due to leverage. 69% and 73% of retail investor accounts lose money when trading CFDs with Tickmill UK Ltd and Tickmill Europe Ltd respectively. You should consider whether you understand how CFDs work and whether you can afford to take the high risk of losing your money.
Futures and Options: Trading futures and options on margin carries a high degree of risk and may result in losses exceeding your initial investment. These products are not suitable for all investors. Ensure you fully understand the risks and take appropriate care to manage your risk.
Patrick has been involved in the financial markets for well over a decade as a self-educated professional trader and money manager. Flitting between the roles of market commentator, analyst and mentor, Patrick has improved the technical skills and psychological stance of literally hundreds of traders – coaching them to become savvy market operators!